High-Resolution Analytical Characterization of Optibumin®: Structural Homogeneity and Functional Consistency Compared to Plasma-Derived HSA
Published on 18 February 2026
Application Note
EXECUTIVE SUMMARY
Raw material consistency is critical to reproducible biopharmaceutical manufacturing and cell culture performance. Human serum albumin (HSA) is widely used as a functional excipient, yet plasma-derived HSA (pHSA) exhibits structural heterogeneity and lot-to-lot variability that can affect downstream applications. Structural homogeneity directly influences ligand binding and conjugation performance.
This application note presents a high-resolution analytical characterization of Optibumin, a chemically defined, animal-origin-free recombinant human serum albumin. Using SEC, IEX-HPLC, RP-HPLC, and functional binding assays, we primarily compare Optibumin to plasma-derived HSA, with additional comparisons to selected commercially available recombinant HSA sources. The data demonstrate Optibumin’s structural homogeneity, low aggregate burden, predominantly reduced Cys34, and preserved binding function, supporting consistent performance across production lots.
Key Highlights
- <0.5% total aggregates by high-resolution 3 μm SE
- ~99% reduced Cys34 across 10 production lots
- Single-peak homogeneity by IEX-HPLC with no detectable charge variants
- ~3-fold higher maleimide conjugation efficiency vs pHSA
- ~3-fold higher binding affinity (Kd 2.58 μM vs 7.45 μM)
INTRODUCTION
The Evolution of Albumin Sourcing
The trajectory of albumin sourcing reflects the broader evolution of biotechnology: a progression from biological variability toward defined engineering precision. For decades, the industry has relied exclusively on plasma-derived HSA (pHSA), a byproduct of the fractionation of human blood. While abundant, pHSA is intrinsically heterogeneous. It is a biological record of the donor population, influenced by diet, disease state, pharmaceutical consumption, and age. Furthermore, the mandatory safety steps required to render blood products safe, specifically pasteurization at 60°C for 10 hours, impose severe thermal stress on the molecule, necessitating the addition of lipid stabilizers that alter its biophysical properties.
The advent of recombinant DNA technology promised a solution. First-generation recombinant albumins, expressed primarily in yeast hosts like Saccharomyces cerevisiae or Pichia pastoris, successfully addressed the risk of blood-borne pathogens. However, these systems introduced new complexities. Yeast-derived albumins often require extensive purification to remove immunogenic host cell proteins (HCPs) and are frequently formulated with surfactants like Polysorbate 80 to prevent aggregation during processing and storage.
Optibumin represents the next generation of recombinant technology. Expressed in a scalable non-mammalian system, it leverages the natural protein-storage machinery to produce albumin in a highly stable, protected environment. This system is inherently free of mammalian pathogens and prions. The expression system allows for the production of a “native-state” molecule that does not require harsh stabilizers or surfactants that compromise the functionality of yeast and plasma-derived alternatives.
The Functional Imperative
In modern bioprocessing, albumin is rarely used solely for its bulk osmotic properties. It is employed as a precise functional excipient. In the expansion of T-cells and Mesenchymal Stem Cells (MSCs), it serves as a lipid carrier and ROS scavenger. In diagnostic immunoassays, it acts as a blocking agent that must cover surfaces uniformly without interfering with specific binding events. In antibody-drug conjugates (ADCs), it functions as a scaffold where defined stoichiometry is paramount. Furthermore, albumin is increasingly utilized in medical device coatings to provide a biomimetic layer that enhances lubricity while imparting essential hemocompatibility and antithrombogenic properties to blood-contacting surfaces.
In these high-value applications, the “batch effects” associated with pHSA, where one lot performs perfectly and the next fails, are unacceptable. The industry requires a reagent that is chemically defined and strictly controlled. This report provides analytical evidence that Optibumin meets these rigorous demands, directly comparing its structural and functional characteristics to plasma- and yeast-derived HSA.
Accurate assessment of albumin structural integrity therefore requires analytical methods capable of resolving low-level aggregates and charge variants with sufficient sensitivity.
RESULTS AND DISCUSSION
Resolution Limitations in Standard SEC Methods
Protein aggregation is a critical quality attribute (CQA) that directly impacts the safety and efficacy of biologic products. Aggregates can serve as nucleation sites for further instability, reduce the effective concentration of the active protein, and, most critically, induce immunogenicity by breaking B-cell tolerance (Ratanji et al., 2014). Detecting these aggregates is the primary function of size exclusion chromatography (SEC). However, the ability to detect aggregates is entirely dependent on the resolution of the method employed.
The Limitations of the USP Standard
The United States Pharmacopeia (USP) monograph for “rAlbumin Human” and General Chapter “Analytical Procedures for Recombinant Therapeutic Monoclonal Antibodies” have long established the industry standard for SEC (United States Pharmacopeia [USP], 2017). These methods typically specify the use of an L59 packing material, a silica-based hydrophilic resin, with a particle size of 5 μm.
While robust and widely accessible, 5 μm SEC columns have inherent resolution limitations. Larger particle sizes reduce column efficiency and increase band broadening, limiting separation of closely eluting species.
In albumin analysis, this limitation is critical. The hydrodynamic radius of an albumin dimer is ~5.2 nm (MW ~130 kDa) which is only modestly larger than that of the monomer at ~3.8 nm (MW ~66.5 kDa) (Ghuman et al., 2005). On a 5 μm column, the dimer peak frequently elutes as a shoulder on the leading edge of the monomer peak rather than as a fully resolved species.
Additionally, the USP rAlbumin Human monograph specifies an injection mass of 2 mg (50 μL injection volume of a 40 mg/mL solution). Because SEC is a non-binding technique, peak shape and resolution are particularly sensitive to injection parameters. High
protein concentration increases local viscosity, and when the less viscous mobile phase starts to interact with the loaded sample, an effect occurs called “viscous fingering” (Rousseaux et al., 2007). This effect results in peak broadening, poor resolution and the potential for the monomer peak to mask the dimer peak.
Artificial Monomer Inflation
Under lower-resolution SEC conditions, incomplete separation of dimer species from the monomer peak can lead to what we describe as “artificial monomer inflation.” When dimers are not fully resolved, integration algorithms—particularly those using perpendicular drop methods—may incorporate the dimer shoulder signal into the monomer peak area. This results in overestimation of apparent monomer purity and underreporting of low-order aggregates.
High-resolution SEC using 3 μm particle size resins mitigates this limitation by physically separating dimer species from the monomer peak, creating a distinct valley between peaks and enabling accurate quantification of aggregate content.
Reported monomer purity values are therefore method-dependent and must be interpreted in the context of column resolution and injection conditions.
3 μm High-Resolution SEC
To rigorously validate the structural integrity of Optibumin, InVitria employs a more stringent analytical method utilizing a 3 μm particle size resin; moreover, the injection parameters, volume and concentration, are set in such a way to ensure resolution between the monomer and any aggregates. Reducing the particle size from 5 μm to 3 μm significantly increases the theoretical plate count, resulting in sharper, narrower peaks. This enhanced efficiency provides the resolution necessary to physically separate the dimer species from the monomer, creating a distinct “valley” between the peaks. Under these conditions, any aggregates present are clearly visible and accurately quantified.
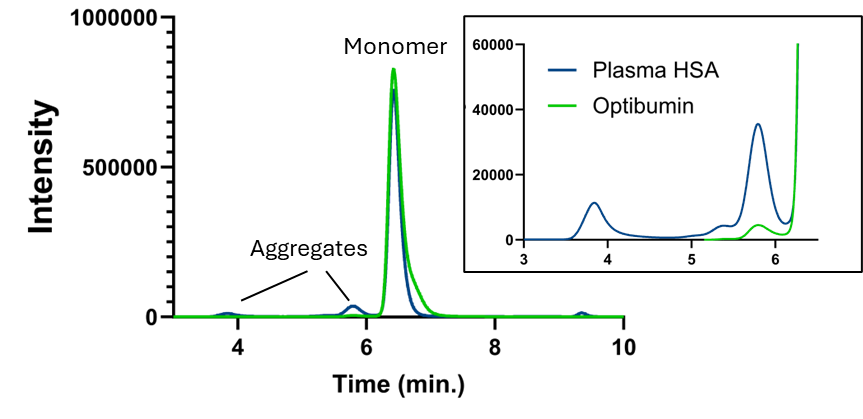
When subjected to this high-resolution SEC analysis, the difference between Optibumin and clinical-grade pHSA is clearly observable. The chromatograms in Figure 1A reveal that Optibumin elutes as a single, symmetrical monomeric peak. The baseline in the
region corresponding to high molecular weight species is flat. In contrast, Figure 1B shows the pHSA samples which display significant absorbance in the pre-monomer region indicating a heterogeneous mixture of oligomeric species. Optibumin contains less than 0.5% total aggregates (Figure 1C, Table 1), a value that approaches the limit of detection even for high-resolution methods. In contrast, clinical-grade pHSA contains an average of 7.5% aggregates (Figure 1C, Table 1). When analyzed with sufficient resolution to accurately quantitate aggregates, it becomes clear that using pHSA introduces a substantially higher aggregate fraction that is introduced into any downstream process.
Furthermore, Optibumin demonstrates low inter-lot variability. The standard deviation of the aggregate fraction is just 0.20%, whereas pHSA varies by 3.57%, a more than 10-fold difference in variability (Table 1). This implies that a user of pHSA might receive one lot with 4% aggregates and the next with 11%, a fluctuation that may impact sensitive applications like cell culture expansion or conjugation efficiency.

Table 1. Comparative Analysis of Aggregates via High-Resolution SEC-HPLC.
| Metric | Optibumin (Recombinant) | Plasma HSA (Clinical Grade) | Statistical Significance |
| Mean Aggregate Fraction (dimer + HMW) | 0.47% | 7.52% | Welch’s t-test |
| (p = 8.0 × 10–⁵) | |||
| Standard Deviation (Inter-lot) | 0.20% | 3.57% | F-test |
| (p < 1.0 × 10–⁴) | |||
| Variance Factor | 1x (Baseline) | ~10x Higher Variability |
Orthogonal Confirmation of Aggregates
To validate the SEC findings, two additional cornerstone techniques for protein separation were employed: Capillary electrophoresis (CE) and polyacrylamide gel electrophoresis (PAGE). When run in reduced and denatured conditions (i.e., CE-SDS and SDS-PAGE), both techniques separate proteins based on their hydrodynamic size in an electric field; however, when run in conditions that do not reduce or breakdown aggregates (i.e., Native-PAGE), these techniques separate proteins based on their native charge, size and hydrodynamic radius (shape). These techniques provide a separation mechanism distinct from the size-sieving effect of SEC and provide visual and quantifiable confirmation of the aggregation state of albumin.
Quantification of Aggregates via Capillary Electrophoresis
The CE electropherograms for Optibumin show a clean monomeric band running just below 66 kDa, with negligible signal in the high-molecular-weight region (Figure 2A). Conversely, analysis from four sources of pHSA exhibit characteristic “smearing” above the monomer band, along with distinct peaks corresponding to dimers and trimers (Figure 2A). Area per loaded mass quantification of the aggregate peak for Optibumin was 39,000 area/μg of loaded mass on average, whereas the pHSA samples averaged 403,000 area/μg of loaded mass (Figure 2B). Nearly identical to the SEC findings, this represents a 10-fold reduction in aggregate burden (p<0.05) for Optibumin. The concordance between the high-resolution SEC and CE data confirms that the superior homogeneity of Optibumin is a physical reality, not an analytical artifact.

Native-PAGE and Understanding Product Versus Process Impurities
While harder to quantify, time-consuming, and considered outdated in many laboratory settings, Native-PAGE is the gold standard for visualizing a product’s purity. In fact, the USP rAlbumin Human monograph specifies testing “purity” by Native-PAGE. The guidance outlines loading and running 20 μg of rHSA product on the gel. This mass of protein undoubtedly saturates the main rHSA monomer band on the gel, but the intent is to show any low molecular weight bands which may be present: “If bands are present below the main albumin band in either or both lanes, quantify the relative amount, in ng, of protein present in each band against the calibration curve” (USP, 2017).
When running pHSA alongside Optibumin per the USP guidance (Figure 3A), both products would claim “100 %” per the USP; however, it is visually evident by the smearing and banding pattern above the pHSA main band that there are numerous aggregate impurities of pHSA. This is also the case when analyzing other rHSA manufactures alongside Optibumin (Figure 3B). Even when loading markedly less mass on the gel in the first four lanes, the rHSA USP reference standard material starts to show aggregates. This result begs the question: what does “purity” mean in the sense of a protein product?
“Purity” in the sense of a protein product can mean many things depending on how one chooses to classify the impurities. A process related protein impurity originates from the manufacturing process and is chemically distinct from the target protein: for example, a host cell protein or a protein-A fragment leached from resin. A product related protein impurity is derived from the product (i.e., target protein) and could be a fragment, aggregate or other variant caused by a post translation modification. High molecular weight HSA (i.e., aggregates) are never mentioned in the USP’s Native-PAGE guidance for rHSA “purity”, but that does not mean they are not present or that they should not be characterized as impurities.

Native Structural Homogeneity and Reduced PTM Burden
The manufacturing process of pHSA is inherently variable from the very beginning due to the starting biomaterial being plasma sourced from various healthy donors. Furthermore, the Cohn fractionation and viral heat inactivation steps used in pHSA manufacturing are generally considered a “harsh” environment for proteins. These steps are known to induce and isolate modified versions of human serum albumin (Oettl and Stauber, 2007).
Optibumin is manufactured from quality controlled, homogeneous starting material using low stress processing steps. The steps of the Optibumin process are specifically designed to isolate and produce a rHSA product that is structurally homogenous with reduced post translation modification (PTMs) burden. To show this, we have developed two analytical HPLC methods to show the modification state of the pHSA and Optibumin.
Analytical Characterization of Thiol Content via RP-HPLC
In the bloodstream, albumin acts as a sacrificial antioxidant. Over its several week half-life, the Cys34 thiol is progressively oxidized by circulating free radicals, converting mercapto-albumin, sometimes called HMA, into oxidized-albumin (Oettl and Stauber, 2007). This oxidized fraction includes mixed disulfides with cysteine or glutathione (reversible oxidation) and higher oxidation states like sulfinic or sulfonic acid (irreversible oxidation). The liver maintains albumin homeostasis by removing oxidized albumin from the bloodstream so that it can be replaced with unmodified, reduced albumin having a free Cys34 thiol group (i.e., mercapto-albumin) (Holte et al., 2023). As covered in numerous reviews (Oettl and Stauber, 2007; Wu et al., 2023) and with our own in vitro functional data later in this application note, the oxidation PTM is particularly detrimental to many of albumin’s binding and carrier functions in the body.
To assess the redox state of Cys34 of Optibumin and pHSA, reverse-phase HPLC (RP-HPLC) was performed to separate the albumin species based on subtle differences in hydrophobicity induced by the oxidation of the cysteine residue. The RP-HPLC profile of Optibumin in Figure 4A displays a single, sharp, symmetrical peak at 13 minutes of retention time. This indicates that the population of albumin molecules is chemically homogeneous, with the Cys34 residue existing almost exclusively in the reduced state. Conversely, the chromatograms for pHSA are complex, showing split peaks and shoulders (Figure 4A). The main reduced-Cys34 peak at 13 minutes is accompanied by a significant secondary peak at 12 minutes representing the cysteinylated (oxidized) fraction.
To characterize the consistency of available reduced-Cys34, an analysis of 10 lots of Optibumin and 9 lots of clinical-grade pHSA were performed. Figure 4B and Table 2 show that across the 10 lots of Optibumin there is 99% reduced Cys34 albumin on average, while the 9 lots of pHSA show only 60% reduced-Cys34 albumin on average. Moreover, Optibumin exhibits approximately ten-fold lower lot-to-lot variability in reduced-Cys34, with an inter-lot standard deviation of just 0.295% compared to 2.93% for pHSA’s standard deviation.

Table 2. Comparative Cys34 Redox Consistency.
| Metric | Optibumin | pHSA | Statistical Significance |
| Mean Free Thiol (Cys34) | 99% | ~60% | Welch’s t-test |
| (p < 1.0 × 10–⁴) | |||
| Oxidized Fraction | ~1% | ~40% | – |
| Inter-lot Standard Deviation | 0.30% | 2.93% | F-test |
| (p < 1.0 × 10–⁴) | |||
| Variance Factor | 1x | 10x | – |
Charged Variant Analysis via IEX-HPLC

Parallel to the RP-HPLC, we wanted to further assess the level of PTMs in several lots of Optibumin and pHSA using Ion Exchange HPLC (IEX-HPLC). Whereas RP-HPLC uses differences in hydrophobicity for separation, IEX-HPLC separates HSA isoforms based on their net surface charge. With slight modifications, a previously detailed IEX-HPLC protocol was followed which uses an anion exchange resin and an increasing concentration of ammonium acetate at neutral pH to elute HSA (Leblanc et al., 2018).
Modifications like deamidation and glycation typically add negative charge, causing species to elute later (acidic variants), while truncations can create basic variants that elute before the unmodified albumin. (While beyond the scope of this application note, variants separated with this IEX-HPLC method have been previously characterized by mass spectrometry (Leblanc et al., 2018).
Analysis of three independent lots of Optibumin revealed a remarkably clean profile (Figure 5A). Optibumin elutes as a single main peak, accounting for essentially all detectable peak area under the conditions tested. No acidic or basic shoulders associated with deamidation or glycation were detected. This indicates that the Optibumin molecule is chemically homogeneous with respect to surface charge.
In contrast, all four lots of pHSA analyzed displayed a complex profile with several peaks representing several charged variants (Figure 5B-E). The chromatograms showed 3 to 4 distinct peaks, corresponding to a “Main” isoform surrounded by significant “Basic” and “Acidic” variants. The abundance of the “Main” isoform in pHSA was low and variable, ranging from 27% to 48% of the total protein. The “Acidic” fraction, likely representing glycated and deamidated species, constituted up to 53% of the total protein in some lots. Together IEX and RP-HPLC analysis indicate that Optibumin exhibits a single dominant species with minimal detectable PTMs.
The HSA Structure/Function Connection
The structure of a protein can shed light on its functional performance. Table 3 summarizes the numerous incidents from literature showing how PTMs and aggregates of HSA can significantly impair its function. This structure/function framework provides the necessary context for our subsequent functional data, which demonstrates how the high structural integrity of InVitria’s Optibumin recombinant albumin translates to improved functional performance compared to plasma-derived HSA.
Implications for Conjugation
As demonstrated in section “Analytical Characterization of Thiol Content via RP-HPLC”, Optibumin contains 99% Cys34 thiol versus only 60% in pHSA. Under the conditions tested, this translated into improved conjugation efficiency. To evaluate this effect, we performed a comparative study using Alexa Fluor 488 C5 maleimide, directly comparing the conjugation efficiency of Optibumin and pHSA. Conjugation reactions were performed under controlled pH conditions using degassed buffer to minimize maleimide hydrolysis and reduce off-target amine reactivity (Kirkpatrick et al., 2024). Alexa Fluor™ 488 C5 maleimide contains a short carbon linker that facilitates access to the Cys34 thiol located within a surface pocket on albumin (Kratz et al., 2002).
Proper reaction conditions are therefore essential to ensure selective thiol conjugation. Optibumin demonstrated a 3-fold higher conjugation efficiency compared to pHSA (Figure 6).
The extent of conjugation increased linearly (R2=0.9920) across a broad range of dye-to-protein molar ratios, indicating that nearly every albumin molecule was available for reaction. pHSA, conversely, showed saturation at lower ratios and poor linear behavior (R2=0.9053), reflecting its heterogeneous composition. Moreover, pHSA contains approximately 40% oxidized (non-reactive) albumin, which can act as a variable “sink” in the reaction mixture and may contribute to non-specific interactions, thereby reducing the fraction of reactive thiol available for controlled conjugation. In addition, pHSA exhibits approximately ten-fold greater lot-to-lot variability in reduced Cys34. This reduced reactive fraction complicates accurate dye-to-protein ratio calculations.
Many diagnostic reagents, drug linkers, and polymer conjugates rely on maleimide chemistry to covalently attach to the free thiol of albumin. For developers of Antibody-Drug Conjugates (ADCs) or albumin-binding prodrugs, consistency is critical. It ensures that the drug-to-protein ratio (DPR) can be tightly controlled, reducing batch failures and ensuring consistent pharmacokinetics in vivo.

Functional Implication for Molecule Binding
As demonstrated previously, when compared to pHSA, Optibumin has extremely low aggregates and PTMs. Table 3 reviews the literature showing how these two factors affect HSA binding to ligands such as fatty acids and drugs. This should translate directly into Optibumin having superior performance in drug binding assays.
To demonstrate this, we performed a comparative study using warfarin and compared the binding efficiency of Optibumin to that of pHSA. Albumin contains two primary high-affinity drug-binding sites: Sudlow Site I, also known as the “warfarin binding site,” which binds bulky heterocyclic compounds, and Sudlow Site II, which binds aromatic carboxylates. To quantify the functional difference between pHSA and Optibumin, we performed equilibrium dialysis and UV-Vis spectroscopy to construct Scatchard plots,
allowing for the precise determination of the dissociation constant (Kd) for warfarin binding.
Optibumin displayed a Kd of 2.58 μM for warfarin (Figure 7). This value is consistent with literature-reported values for native, unliganded albumin (~3 μM) (Sudlow et al., 1975; Diana et al., 1989; Loun and Hage, 1994). It confirms that the binding pockets in Optibumin are open, accessible, and functionally native. pHSA displayed a significantly higher Kd of 7.45 μM. This represents a nearly 3-fold reduction in binding affinity compared to Optibumin.
In addition to structural heterogeneity, there is another possible explanation for pHSA’s poor performance in this instance. In order to survive the mandatory 60°C pasteurization step used during manufacturing, pHSA is formulated with high concentrations (typically 16-32 mM) of stabilizers, most notably sodium octanoate (caprylate) and N-acetyl-L-tryptophan. These are not passive additives; they are active ligands that bind with high affinity to specific pockets on the albumin molecule. Prior studies have demonstrated that sodium octanoate binds preferentially to Sudlow Site II with very high affinity (Faroongsarng and Kongprasertkit, 2014; Tramarin et al., 2019; Kragh-Hansen 1991; Harm et al., 2018; Olsen et al., 2004). Furthermore, the binding of fatty acids (like octanoate) induces conformational changes that can allosterically reduce the binding affinity of ligands at Sudlow Site I (Yamasaki et al., 1999; Ghuman et al., 2005). Consequently, plasma-derived HSA may contain stabilizers that occupy ligand-binding sites, effectively pre-occupying or sterically hindering these regions. This reduces the albumin’s capacity to bind, transport, and solubilize drugs, hormones, and toxins.
The presence of aggregates, PTMs and stabilizers in pHSA may reduce ligand-binding capacity. For drug delivery applications, this means that pHSA will carry less drug, potentially altering the pharmacokinetic (PK) profile by increasing the free fraction of the drug in circulation. Optibumin, being structurally homogenous and free of caprylate and tryptophan stabilizers, offers a predictable, high-affinity carrier that mimics the native biology of unliganded albumin.

Table 3: Albumin PTMs linked to functional performance.
| Albumin Form | Major Functional Change | Example | Reference(s) |
| Oxidized | Binding Capacity | Metal ion | Ge et al., 2016 |
| Fatty acid | Ge et al., 2016 | ||
| Various Drugs | Anraku et al., 2001; Kawakami et al., 2006 | ||
| Fluorescent marker | Oettl et al., 2013 | ||
| Bilirubin | Oettl et al., 2008 | ||
| Receptor Affinity | FcRn | Leblanc et al., 2019 | |
| Transport | Fatty acid | Jalan et al., 2009 | |
| Antioxidant | IMAR | Jalan et al., 2009 | |
| Free radical scavenging | Kawakami et al., 2006 | ||
| Glycated | Binding Capacity | Fatty acid | Shaklai et al., 1984 |
| Drugs | Okabe et al., 1994; Baraka-Vidot et al., 2012; Joseph and Hage 2010 | ||
| Bilirubin | Shaklai et al., 1984 | ||
| Trp | Nakajou et al., 2003; and Berzegar et al., 2007 | ||
| Receptor Affinity | FcRn | Leblanc et al., 2019 | |
| Nitrated | Binding Capacity | fatty acids | Burczynski et al., 1995 |
| Truncated | Binding/Antioxidant | Metal ion/Free radical scavenging | Bar-Or et al., 2001; Naldi et al., 2013 |
| Receptor Affinity | FcRn | Andersen et al., 2012; and Bar-Or et al., 2006 | |
| Aggregated | Binding Capacity | Fatty acid | Chubarov et al., 2021 |
CONCLUSION
The data presented in this application note demonstrate that “albumin” is not a commoditized generic. The source of the protein and the processing it undergoes fundamentally influence structural quality and functional performance. While plasma-derived HSA (pHSA) remains a standard excipient, its utility in next-generation biotechnology is severely compromised by three factors:
- Hidden aggregation: Standard lower-resolution 5 μm SEC methods may under-resolve low-order aggregates (dimers and trimers) which averaged ~7.5% in pHSA and are clearly separated under 3 μm high-resolution analysis.
- Structural heterogeneity: The Cys34 thiol in pHSA is substantially oxidized (~40%), contributing to lot-to-lot variability that affects conjugation stoichiometry and antioxidant function.
- Stabilizer interference: The obligatory addition of sodium octanoate and related stabilizers occupies the protein’s natural binding sites, reducing affinity for drugs and ligands by nearly 3-fold.
From a regulatory standpoint, the variance seen in pHSA, where the “native” protein may constitute less than a third of the total mass, poses a significant regulatory challenge. Under ICH Q6B guidelines, manufacturers must characterize and control impurities. Using pHSA as an excipient introduces a raw material that is essentially a mixture of distinct isoforms, each with potentially different stability and binding properties. This complicates the validation of analytical assays and the establishment of release criteria for the final drug product. Optibumin, with its single-peak homogeneity, provides a consistent, defined baseline that simplifies regulatory submissions and quality control.
Optibumin addresses these limitations. Produced in a non-mammalian expression system without blood sourcing, pasteurization, or added stabilizers, Optibumin demonstrates >99% monomeric content predominantly reduced Cys34 and preserved functional binding activity. For developers of cell therapies, gene therapies, vaccines, advanced diagnostics, and protein formulations, transitioning to Optibumin represents a move from biological variability to engineering precision.
MATERIALS & METHODS
High-Resolution Size Exclusion Chromatography (SEC-HPLC)
Samples were prepared at 1 mg/mL concentration in mobile phase buffer, 40 mM sodium phosphate, 200 mM sodium chloride, pH 7.0. Using a Shimadzu HPLC system capable of detecting 215 and 280 nm, 10 μL of samples were injected in triplicate onto a Phenomenex Yarra™ SEC-3000 column (300 Å pore size, 3 μm particle size, 4.6 × 300 mm; 00H-4513-E0 Phenomenex, CA). The flow rate was 0.5 mL/min. Chromatograms were integrated to quantify the area of high molecular weight (HMW) species (dimers, trimers, oligomers) relative to the main monomer peak.
Reverse-Phase HPLC (RP-HPLC) for Cys34 Redox Analysis
Reverse-phase HPLC (RP-HPLC) was conducted on a 1290 Infinity II HPLC system equipped with a quaternary pump (G7104A), 1290 Infinity II DAD FS Detector (G7117A), and an InfinityLab™ Bio-Inert Max-Light cartridge cell (10 mm; G5615-60018, Agilent Technologies, CA).
Chromatographic separation was achieved using an ACQUITY™ UPLC Protein BEH C4 column (300 Å pore size, 1.7 μm particle size, 2.1 × 150 mm; 186004497, Waters Corporation, MA). Mobile phase A consisted of LC-MS water with 0.1% trifluoroacetic acid (TFA), and mobile phase B consisted of 100% acetonitrile with 0.1% TFA. A shallow gradient of the mobile phase B (35% to 40%) was applied to resolve two major albumin species. Detection of albumin species was performed at 215 and 280 nm, while free Alexa Fluor™ 488 C5 maleimide dye (A10254, Thermo Fisher, MA) and dye-conjugated albumin were monitored at 498 nm. Data acquisition and analysis were conducted using MassHunter® Software (Agilent Technologies, CA).
IEX-HPLC for Charge Variant Analysis
Samples were prepared at 1 mg/mL in mobile phase buffer A, (50 mM ammonium acetate, pH 7.4). Using a Shimadzu HPLC system, 10 μL of sample was injected onto an Agilent Bio WAX NP5 column (non-porous, 5 μm, 2.1 × 250 mm, PEEK hardware; 5190-2491, Agilent Technologies, CA) with detection at 215 and 280 nm. The flow rate was 0.5 mL/min. Mobile phase A was held at 100% for 5 minutes, followed by a 22-minute linear gradient from 0 to 100% mobile phase B (50 mM ammonium acetate, pH 7.4). Valley-to-valley (drop-line) integration was used to quantify percent peak area.
Capillary Electrophoresis (CE)
Albumin samples were diluted to 1 mg/mL and 0.5 mg/mL in 20 mM phosphate buffer containing 50 mM NaCl (pH 7). Aggregation was assessed using chemiluminescence-based capillary electrophoresis on a Wes™ system (ProteinSimple®, a Bio-Techne brand, CA).
Samples were prepared by reconstituting the Fluorescent 5X Master Mix (PS-FL01-8, ProteinSimple, CA) in water and mixing with diluted albumin at a 1:5 ratio (1 part fluorescent master mix to 5 parts samples). Albumin aggregate content was analyzed using Compass for SW™ software (version 6.3.0; ProteinSimple, CA). Signal above the main monomer band (~60 kDa) was quantified using drop-line peak integration. For each sample, the aggregate signal was normalized to injected protein concentration
(1 mg/mL or 0.5 mg/mL) to calculate aggregate band area per injected mass.
Aggregate comparisons were evaluated using Welch’s unpaired t-test for differences in mean and F-test for equality of variance.
Native-PAGE
Albumin samples were prepared in Native-PAGE sample buffer (62.5 mM Tris, pH 6.8, 0.1% bromophenol blue) to a final concentration of 2 mg/mL. Samples were loaded on to a 14% Tris-glycine gel submerged in native Tris-glycine running buffer. 10 μL of USP rHSA reference standards at various concentrations were loaded into lanes 1-4 for quantification of bands below the main monomer band. 10 μL (20 μg) of albumin samples were loaded in the remaining lanes.
Gels were run at 4ºC at a constant voltage of 140 V for 3 hours and 40 minutes. Gels were rinsed with purified water, fixed for 5 minutes, rinsed with water, stained with GelCode™ Blue Staining Reagent (24590, Thermo Fisher, MA), and destained until the
background signal was minimal.
Images were acquired using a AlphaImager™ system and analyzed with AlphaView-FluorChem-Q™ software (version 3.4.0.0; ProteinSimple, CA).
Cys34- Maleimide Conjugation Reaction
Alexa Fluor 488 C5 maleimide was reconstituted in DMSO according to the manufacturer’s instructions and diluted in degassed PBS adjusted to pH 6. Conjugation reactions were performed under controlled pH conditions to minimize hydrolysis and off-target amine reactivity. Reaction mixtures were prepared using defined dye-to-protein molar ratios as described in the results section.
Warfarin Binding Kinetics
Warfarin sodium salt was prepared at a stock concentration of 1 mg/mL in deionized water. The stock was serially diluted two-fold to generate concentrations spanning four orders of magnitude. UV-Vis absorbance spectra were recorded for each dilution to construct a standard curve and define the linear range of the absorbance range at 310 nm for quantitation of free warfarin.
Plasma-derived HSA was desalted by spin filtration to remove N-acetyl tryptophan, which inter-feres with absorbance measurements at 280 nm. This step was not required for Optibumin be-cause it contains no such additives. Stocks of Optibumin and pHSA were prepared at 0.2 mg/mL as determined by A280. To evaluate the binding affinity, Optibumin or pHSA was first mixed 1:1 with serial dilutions of warfarin within the established linear detection range. Final albumin concentration was 0.1 mg/mL in a total
reaction volume of 1 mL. Absorbance spectra were recorded to measure total warfarin (free and bound). Samples were subsequently buffer-exchanged using spin filtration with a 3 kDa molecular weight cutoff (MWCO) membrane to separate free and bound fractions.
The flowthrough and retentate were each adjusted to total volumes of 1 mL each and quantified by UV-Vis.
The flowthrough contained free warfarin and the retentate contained albumin-bound warfarin. Albumin background absorbance was subtracted from both total and bound measurements prior to analysis.
Binding data were fitted to the Scatchard equation to determine the dissociation constant (Kd) from the slope and the number of binding sites (n) from the x-intercept.
Featured Solution

Optibumin 25 – Recombinant Human Serum Albumin, 25% Solution – Animal-Origin-Free, GMP-Produced
Optibumin® 25 is a chemically defined, recombinant human serum albumin designed to deliver structural homogeneity and consistent functional performance in advanced bioprocessing applications. As demonstrated in this application note, Optibumin exhibits <0.5% aggregates by high-resolution SEC, ~99% reduced Cys34 content, and a single dominant isoform by IEX-HPLC, supporting reproducible conjugation efficiency and ligand-binding affinity.
Unlike plasma-derived HSA, Optibumin is free from stabilizers such as caprylate and N-acetyl tryptophan and avoids variability associated with blood-derived sourcing. The result is a highly consistent, animal-origin-free albumin suitable for cell therapy, gene therapy, vaccine formulation, protein conjugation, and other applications where structural integrity directly impacts performance.
Ready to try Optibumin 25?
Get a free evaluation sample or request a quote for your project.
Analytical Characterization FAQs
Method Resolution and Analytical Sensitivity
Why Does Standard 5 µm SEC Underestimate Albumin Aggregates?
The USP rAlbumin Human monograph specifies 5 µm L59 silica-based SEC columns and a 2 mg injection mass. At this resolution, the albumin dimer peak (hydrodynamic radius ~5.2 nm) elutes as an unresolved shoulder on the leading edge of the monomer peak (~3.8 nm), and the high injection mass causes viscous fingering that broadens peaks further. Integration algorithms — particularly perpendicular drop methods — incorporate the dimer signal into the monomer peak, inflating apparent monomer purity and underreporting low-order aggregates. Reported monomer purity is therefore method-dependent and must be interpreted in the context of column resolution and injection conditions.
What Is “Artificial Monomer Inflation”?
Artificial monomer inflation is the overestimation of monomer purity that occurs when low-resolution SEC fails to separate dimer species from the main monomer peak. Because the dimer signal is integrated into the monomer area, monomer percentage is overstated and aggregate content is understated. High-resolution 3 µm SEC physically separates the dimer with a baseline-resolved valley between peaks, enabling accurate quantification of low-order aggregate content.
What Method Does InVitria Use to Quantify Aggregates in Optibumin?
InVitria uses a 3 µm particle size SEC-HPLC method on a Phenomenex Yarra SEC-3000 column (300 Å, 4.6 × 300 mm) with controlled injection parameters that preserve resolution between monomer and aggregate species. The reduced particle size increases theoretical plate count and produces sharper, narrower peaks, enabling baseline-resolved separation of dimers from the monomer peak. Findings are confirmed by orthogonal methods including capillary electrophoresis and Native-PAGE.
Aggregate Content and Lot-to-Lot Variability
How Much Aggregate Content Does Optibumin Contain Compared to Plasma-Derived HSA?
By high-resolution 3 µm SEC across 15 lots of Optibumin and 8 lots of clinical-grade plasma HSA, Optibumin contains less than 0.5% total aggregates (mean 0.47%) versus approximately 7.5% for plasma HSA — roughly a 16-fold difference (Welch’s t-test, p = 8.0 × 10⁻⁵). Capillary electrophoresis confirmed an approximately 10-fold reduction in aggregate burden by an independent separation mechanism.
How Consistent Is Optibumin’s Aggregate Content Across Lots?
Optibumin’s inter-lot standard deviation for aggregate fraction is 0.20%, compared to 3.57% for plasma HSA — a more than 10-fold difference in variability (F-test, p < 1.0 × 10⁻⁴). In practical terms, a user of plasma HSA might receive one lot at 4% aggregates and the next at 11%, while Optibumin lots remain tightly clustered below 0.5%.
Why Does Native-PAGE Matter for Albumin Purity Assessment?
The USP rAlbumin Human monograph specifies Native-PAGE for purity testing, but the guidance focuses on quantifying low molecular weight bands below the main monomer band — not high molecular weight aggregates above it. When Optibumin is run alongside plasma HSA per USP guidance, both products would be reported as “100% pure,” yet visual inspection clearly shows smearing and banding above the plasma HSA main band that indicates substantial aggregate impurities. Aggregates are product-related impurities even when not addressed by compendial purity assays.
Cys34 Redox State and Post-Translational Modifications
What Is the Cys34 Redox State of Optibumin Compared to Plasma HSA?
By RP-HPLC across 10 lots of Optibumin and 9 lots of plasma HSA, Optibumin contains approximately 99% reduced (unmodified) Cys34 on average, while plasma HSA averages approximately 60% reduced Cys34. The remaining ~40% of plasma HSA Cys34 is oxidized — primarily as cysteinylated mixed disulfides, with smaller fractions of higher oxidation states (sulfinic and sulfonic acid). Inter-lot standard deviation for reduced Cys34 is 0.30% for Optibumin versus 2.93% for plasma HSA (F-test, p < 1.0 × 10⁻⁴).
Why Is Cys34 Redox State Functionally Important?
Cys34 is albumin’s single free cysteine and serves multiple critical functions: it acts as a sacrificial antioxidant in circulation, provides the reactive handle for maleimide-based bioconjugation, and contributes to ligand binding. Oxidized Cys34 cannot participate in maleimide conjugation, reducing efficiency and producing unpredictable drug-to-protein ratios. Published literature has linked Cys34 oxidation to impaired binding of metal ions, fatty acids, multiple drug classes, fluorescent markers, and bilirubin, as well as reduced FcRn receptor affinity.
How Does Optibumin’s Manufacturing Process Preserve Cys34?
Plasma HSA is produced from pooled donor plasma using Cohn fractionation and 60°C pasteurization for viral inactivation — both of which are harsh conditions that promote oxidation and other PTMs. Optibumin is manufactured from quality-controlled, homogeneous starting material using low-stress processing steps specifically designed to preserve native structure and minimize PTM burden. The result is a chemically homogeneous molecule with a single dominant species detectable by both RP-HPLC and IEX-HPLC.
Charge Variants and Structural Homogeneity
What Does IEX-HPLC Reveal About Optibumin Charge Variants?
By ion exchange HPLC using an anion exchange resin and ammonium acetate gradient at neutral pH, three independent lots of Optibumin elute as a single main peak with no detectable acidic or basic shoulders. In contrast, four lots of plasma HSA show 3 to 4 distinct peaks corresponding to a “main” isoform surrounded by significant “basic” and “acidic” variants, with the main isoform abundance ranging from only 27% to 48% of total protein. The acidic fraction in plasma HSA — likely glycated and deamidated species — constituted up to 53% of total protein in some lots.
What Modifications Drive Charge Variant Formation in Plasma HSA?
Deamidation and glycation typically add negative charge, producing acidic variants that elute later. Truncations can create basic variants that elute earlier. Both modifications accumulate during albumin’s multi-week half-life in circulation and during the manufacturing steps used to fractionate and inactivate plasma. Prior mass spectrometry characterization of plasma HSA charge variants has identified specific glycation, deamidation, and truncation sites.
Functional Performance: Conjugation and Binding
How Much Higher Is Optibumin’s Maleimide Conjugation Efficiency vs. Plasma HSA?
In a controlled comparison using Alexa Fluor 488 C5 maleimide under degassed, pH-controlled conditions, Optibumin demonstrated approximately 3-fold higher conjugation efficiency than plasma HSA. The dye-incorporation profile was linear across a broad range of dye-to-protein molar ratios (R2 = 0.9920), while plasma HSA showed early saturation and poor linearity (R2 = 0.9053). This reflects plasma HSA’s lower available reduced Cys34 (~60%) and the variability introduced by oxidized, non-reactive albumin acting as a reaction sink.
Why Does Plasma HSA Show Reduced Warfarin Binding Affinity?
Optibumin showed a KD of 2.58 µM for warfarin, consistent with literature values for native unliganded albumin (~3 µM). Plasma HSA showed a KD of 7.45 µM — approximately 3-fold weaker (F-test for slope, p < 0.01). Three factors contribute: plasma HSA contains structural heterogeneity and aggregates that reduce accessible binding surface; ~40% of Cys34 is cysteinylated, a modification associated with reduced warfarin binding; and plasma HSA is formulated with sodium octanoate (16–32 mM) and N-acetyl-L-tryptophan stabilizers required to survive pasteurization. Sodium octanoate binds Sudlow Site II with high affinity and allosterically reduces binding at Sudlow Site I, where warfarin binds.
Why Are Plasma HSA Stabilizers a Concern Beyond Drug Binding Studies?
Sodium octanoate and N-acetyl-L-tryptophan are not passive additives — they are active ligands with documented high-affinity binding to specific pockets on albumin. They occupy or allosterically interfere with Sudlow Site I, Sudlow Site II, and fatty acid binding sites that are essential to albumin’s biological and pharmaceutical function. For drug delivery applications, this means plasma HSA carries less drug, potentially increasing the free fraction in circulation and altering pharmacokinetic profile. For analytical assays, stabilizers can interfere with binding-based methods and complicate interpretation.
Regulatory and Quality Implications
What Does Optibumin’s Structural Homogeneity Mean for ICH Q6B Compliance?
Under ICH Q6B guidelines, manufacturers must characterize and control impurities in biologic raw materials. Plasma HSA introduces a raw material that is essentially a mixture of distinct isoforms — in some lots, the “native” protein constitutes less than a third of total mass. Each isoform has potentially different stability and binding properties, complicating analytical assay validation and final drug product release criteria. Optibumin’s single-peak homogeneity by both RP-HPLC and IEX-HPLC provides a defined, consistent baseline that simplifies regulatory submissions and quality control.
How Do Optibumin’s Analytical Specifications Compare to USP rAlbumin Human?
Optibumin is tested with consideration of the USP rAlbumin Human monograph, with release specifications that exceed the purity expectations of the compendial methods. InVitria’s high-resolution analytical characterization — including 3 µm SEC, RP-HPLC for Cys34 redox state, and IEX-HPLC for charge variants — enables more accurate quantitation of monomer purity, low-level aggregate content, and PTM burden than standard compendial methods alone. Full analytical and compendial documentation is available on request.
The following content is gated. Please, subscribe to open access to it.
Footnotes
References
- Andersen, J. T., Dalhus, B., Cameron, J., Daba, M. B., Plumridge, A., Evans, L., Brennan, S. O., Gunnarsen, K. S., Bjørås, M., Sleep, D., & Sandlie, I. (2012). Structure-based mutagenesis reveals the albumin-binding site of the neonatal Fc receptor. Nature Communications, 3, Article 610. https://doi.org/10.1038/ncomms1607
- Anraku, M., Yamasaki, K., Maruyama, T., Kragh-Hansen, U., & Otagiri, M. (2001). Effect of oxidative stress on the structure and function of human serum albumin. Pharmaceutical Research, 18(5), 632–639. https://doi.org/10.1023/A:1011029226072
- Baraka-Vidot, J., Guerin-Dubourg, A., Bourdon, E., & Rondeau, P. (2012). Impaired drug-binding capacities of in vitro and in vivo glycated albumin. Biochimie, 94(9), 1960–1967. https://doi.org/10.1016/j.biochi.2012.05.017
- Bar-Or, D., Curtis, G., Rao, N., Bampos, N., & Lau, E. (2001). Characterization of the Co2+ and Ni2+ binding amino-acid residues of the N-terminus of human albumin: An insight into the mechanism of a new assay for myocardial ischemia. European Journal of Biochemistry, 268(1), 42–48. https://doi.org/10.1046/j.1432-1327.2001.01846.x
- Bar-Or, D., Rael, L. T., Bar-Or, R., Slone, D. S., & Craun, M. L. (2006). The formation and rapid clearance of a truncated albumin species in a critically ill patient. Clinica Chimica Acta, 365(1–2), 346–349. https://doi.org/10.1016/j.cca.2005.08.011
- Barzegar, A., Moosavi-Movahedi, A. A., Sattarahmady, N., Hosseinpour-Faizi, M. A., Aminbakhsh, M., Ahmad, F., Saboury, A. A., Ganjali, M. R., & Norouzi, P. (2007). Spectroscopic studies of the effects of glycation of human serum albumin on L-Trp binding. Protein & Peptide Letters, 14(1), 13–18. https://doi.org/10.2174/092986607779117191
- Burczynski, F. J., Wang, G. Q., & Hnatowich, M. (1995). Effect of nitric oxide on albumin-palmitate binding. Biochemical Pharmacology, 49(1), 91–96. https://doi.org/10.1016/0006-2952(94)00448-u
- Chubarov, A., Spitsyna, A., Krumkacheva, O., Mitin, D., Suvorov, D., Tormyshev, V., Fedin, M., Bowman, M. K., & Bagryanskaya, E. (2021). Reversible dimerization of human serum albumin. Molecules, 26(1), 108. https://doi.org/10.3390/molecules26010108
- Diana, F. J., Veronich, K., & Kapoor, A. L. (1989). Binding of nonsteroidal anti-inflammatory agents and their effect on binding of racemic warfarin and its enantiomers to human serum albumin. Journal of Pharmaceutical Sciences, 78(3), 195–199. https://doi.org/10.1002/jps.2600780304
- Faroongsarng, D., & Kongprasertkit, J. (2014). The role of caprylate ligand ion on the stabilization of human serum albumin. AAPS PharmSciTech, 15(2), 465–471. https://doi.org/10.1208/s12249-014-0076-0
- Ge, P., Yang, H., Lu, J., Liao, W., Du, S., Xu, Y., Xu, H., Zhao, H., Lu, X., Sang, X., Zhong, S., Huang, J., & Mao, Y. (2016). Albumin binding function: The potential earliest indicator for liver function damage. Gastroenterology Research and Practice, 2016, Article 5120760. https://doi.org/10.1155/2016/5120760
- Ghuman, J., Zunszain, P. A., Petitpas, I., Bhattacharya, A. A., Otagiri, M., & Curry, S. (2005). Structural basis of the drug-binding specificity of human serum albumin. Journal of Molecular Biology, 353(1), 38–52. https://doi.org/10.1016/j.jmb.2005.07.075
- Harm, S., Schildböck, C., & Hartmann, J. (2018). Removal of stabilizers from human serum albumin by adsorbents and dialysis used in blood purification. PLoS ONE, 13(1), e0191741. https://doi.org/10.1371/journal.pone.0191741
- Holte, C. F., Szafranska, K. J., Kruse, L. D., Simon-Santamaria, J., Li, R., Svistounov, D., & McCourt, P. A. G. (2023). Highly oxidized albumin is mainly cleared by mouse liver sinusoidal endothelial cells via the receptors stabilin-1 and -2. bioRxiv. https://doi.org/10.1101/2023.07.20.549630
- Jalan, R., Schnurr, K., Mookerjee, R. P., Sen, S., Cheshire, L., Hodges, S., Muravsky, V., Williams, R., Matthes, G., & Davies, N. A. (2009). Alterations in the functional capacity of albumin in patients with decompensated cirrhosis is associated with increased mortality. Hepatology, 50(2), 555–564. https://doi.org/10.1002/hep.22913
- Joseph, K. S., & Hage, D. S. (2010). The effects of glycation on the binding of human serum albumin to warfarin and L-tryptophan. Journal of Pharmaceutical and Biomedical Analysis, 53(3), 811–818. https://doi.org/10.1016/j.jpba.2010.04.035
- Kawakami, A., Kubota, K., Yamada, N., Tagami, U., Takehana, K., Sonaka, I., Suzuki, E., & Hirayama, K. (2006). Identification and characterization of oxidized human serum albumin: A slight structural change impairs its ligand-binding and antioxidant functions. The FEBS Journal, 273(14), 3346–3357. https://doi.org/10.1111/j.1742-4658.2006.05341.x
- Kragh-Hansen, U. (1991). Octanoate binding to the indole- and benzodiazepine-binding region of human serum albumin. Biochemical Journal, 273(Pt 3), 641–644. https://doi.org/10.1042/bj2730641
- Leblanc, Y., Berger, M., Seifert, A., Bihoreau, N., & Chevreux, G. (2019). Human serum albumin presents isoform variants with altered neonatal Fc receptor interactions. Protein Science, 28(11), 1982–1992. https://doi.org/10.1002/pro.3733
- Leblanc, Y., Bihoreau, N., & Chevreux, G. (2018). Characterization of human serum albumin isoforms by ion exchange chromatography coupled on-line to native mass spectrometry. Journal of Chromatography B, 1095, 87–93. https://doi.org/10.1016/j.jchromb.2018.07.014
- Loun, B., & Hage, D. S. (1994). Chiral separation mechanisms in protein-based HPLC columns. 1. Thermodynamic studies of (R)- and (S)-warfarin binding to immobilized human serum albumin. Analytical Chemistry, 66(21), 3814–3822. https://doi.org/10.1021/ac00093a043
- Naldi, M., Giannone, F. A., Baldassarre, M., Domenicali, M., Caraceni, P., Bernardi, M., & Bertucci, C. (2013). A fast and validated mass spectrometry method for the evaluation of human serum albumin structural modifications in the clinical field. European Journal of Mass Spectrometry, 19(6), 491–496. https://doi.org/10.1255/ejms.1256
- Nakajou, K., Watanabe, H., Kragh-Hansen, U., Maruyama, T., & Otagiri, M. (2003). The effect of glycation on the structure, function and biological fate of human serum albumin as revealed by recombinant mutants. Biochimica et Biophysica Acta (BBA) – General Subjects, 1623(2–3), 88–97. https://doi.org/10.1016/j.bbagen.2003.08.001
- Oettl, K., Birner-Gruenberger, R., Spindelboeck, W., Stueger, H. P., Dorn, L., Stadlbauer, V., Putz-Bankuti, C., Krisper, P., Graziadei, I., Vogel, W., Lackner, C., & Stauber, R. E. (2013). Oxidative albumin damage in chronic liver failure: Relation to albumin binding capacity, liver dysfunction and survival. Journal of Hepatology, 59(5), 978–983. https://doi.org/10.1016/j.jhep.2013.06.013
- Oettl, K., & Stauber, R. E. (2007). Physiological and pathological changes in the redox state of human serum albumin critically influence its binding properties. British Journal of Pharmacology, 151(5), 580–590. https://doi.org/10.1038/sj.bjp.0707251
- Oettl, K., Stadlbauer, V., Petter, F., Greilberger, J., Putz-Bankuti, C., Hallström, S., Lackner, C., & Stauber, R. E. (2008). Oxidative damage of albumin in advanced liver disease. Biochimica et Biophysica Acta (BBA) – Molecular Basis of Disease, 1782(7–8), 469–473. https://doi.org/10.1016/j.bbadis.2008.04.002
- Okabe, N., & Hashizume, N. (1994). Drug binding properties of glycosylated human serum albumin as measured by fluorescence and circular dichroism. Biological & Pharmaceutical Bulletin, 17(1), 16–21. https://doi.org/10.1248/bpb.17.16
- Olsen, H., Andersen, A., Nordbø, A., Kongsgaard, U. E., & Børmer, O. P. (2004). Pharmaceutical-grade albumin: Impaired drug-binding capacity in vitro. BMC Clinical Pharmacology, 4, 4. https://doi.org/10.1186/1472-6904-4-4
- Ratanji, K. D., Derrick, J. P., Dearman, R. J., & Kimber, I. (2014). Immunogenicity of therapeutic proteins: Influence of aggregation. Journal of Immunotoxicology, 11(2), 99–109. https://doi.org/10.3109/1547691X.2013.821564
- Rousseaux, G., De Wit, A., & Martin, M. (2007). Viscous fingering in packed chromatographic columns: Linear stability analysis. Journal of Chromatography A, 1149(2), 254–273. https://doi.org/10.1016/j.chroma.2007.03.056
- Shaklai, N., Garlick, R. L., & Bunn, H. F. (1984). Nonenzymatic glycosylation of human serum albumin alters its conformation and function. Journal of Biological Chemistry, 259(6), 3812–3817. https://pubmed.ncbi.nlm.nih.gov/6706980/
- Sudlow, G., Birkett, D. J., & Wade, D. N. (1975). The characterization of two specific drug binding sites on human serum albumin. Molecular Pharmacology, 11(6), 824–832. https://pubmed.ncbi.nlm.nih.gov/1207674/
- Tramarin, A., Tedesco, D., Naldi, M., Baldassarre, M., Bertucci, C., & Bartolini, M. (2019). New insights into the altered binding capacity of pharmaceutical-grade human serum albumin: Site-specific binding studies by induced circular dichroism spectroscopy. Journal of Pharmaceutical and Biomedical Analysis, 162, 171–178. https://doi.org/10.1016/j.jpba.2018.09.022
- United States Pharmacopeia. (2017). NF monographs, rAlbumin human. United States Pharmacopeia. https://doi.org/10.31003/USPNF_M2992_03_01
- Wu, N., Liu, T., Tian, M., Liu, C., Ma, S., Cao, H., Bian, H., Wang, L., Feng, Y., & Qi, J. (2023). Albumin, an interesting and functionally diverse protein, varies from “native” to “effective” (Review). Molecular Medicine Reports, 29(2), Article 24. https://doi.org/10.3892/mmr.2023.13147
- Yamasaki, K., Maruyama, T., Yoshimoto, K., Tsutsumi, Y., Narazaki, R., Fukuhara, A., Kragh-Hansen, U., & Otagiri, M. (1999). Interactive binding to the two principal ligand binding sites of human serum albumin: Effect of the neutral-to-base transition. Biochimica et Biophysica Acta (BBA) – Protein Structure and Molecular Enzymology, 1432(2), 313–323. https://doi.org/10.1016/s0167-4838(99)00098-9